Estimating House Prices in San Francisco
Motivation
When we buy a house, we usually don’t know exactly which house we are going to buy, but we know what kind of houses we want. It is very important to know the price of houses with a specific set of features (size, bathrooms, bedrooms…).
This project is trying to estimate house prices based on the features using publicly available data, and build a web application for house prices estimation.
Data source
House sales record: http://www.sfgate.com/webdb/homesales/
The house sales record was scrapped from sfgate, which is a rendered webpage.
For the code, please see https://github.com/RuiChang123/Regression_for_house_price_estimation/blob/master/scrape_sfgate.py
House features: Zillow API. Including Finished square foot, Lot square foot, Number of bedrooms, bathrooms, total rooms, Built year, House type (single family house, condo…) and Neighborhood.
The code is shown https://github.com/RuiChang123/Regression_for_house_price_estimation/blob/master/linear_regression_house_price.ipynb
S&P/Case-Shiller house price index: https://research.stlouisfed.org/fred2/series/SFXRSA
Time series analysis
To analyze all the house sales price base on the features, I need to adjust the houses prices to the same month. Because it is obvious the value of a house is different now as it was three years ago.
In this model, I assumed that in the past three years all the values of the houses had the same increase rate, which followed the same trend as the house price index.
Unfortunately, The house sales record I got was till Feb, 2016. but the house price index was delayed, only till Jan, 2016. So a simple time series analysis using ARMA (Autoregression moving average) was made in order extend the house price index to Feb, 2016.
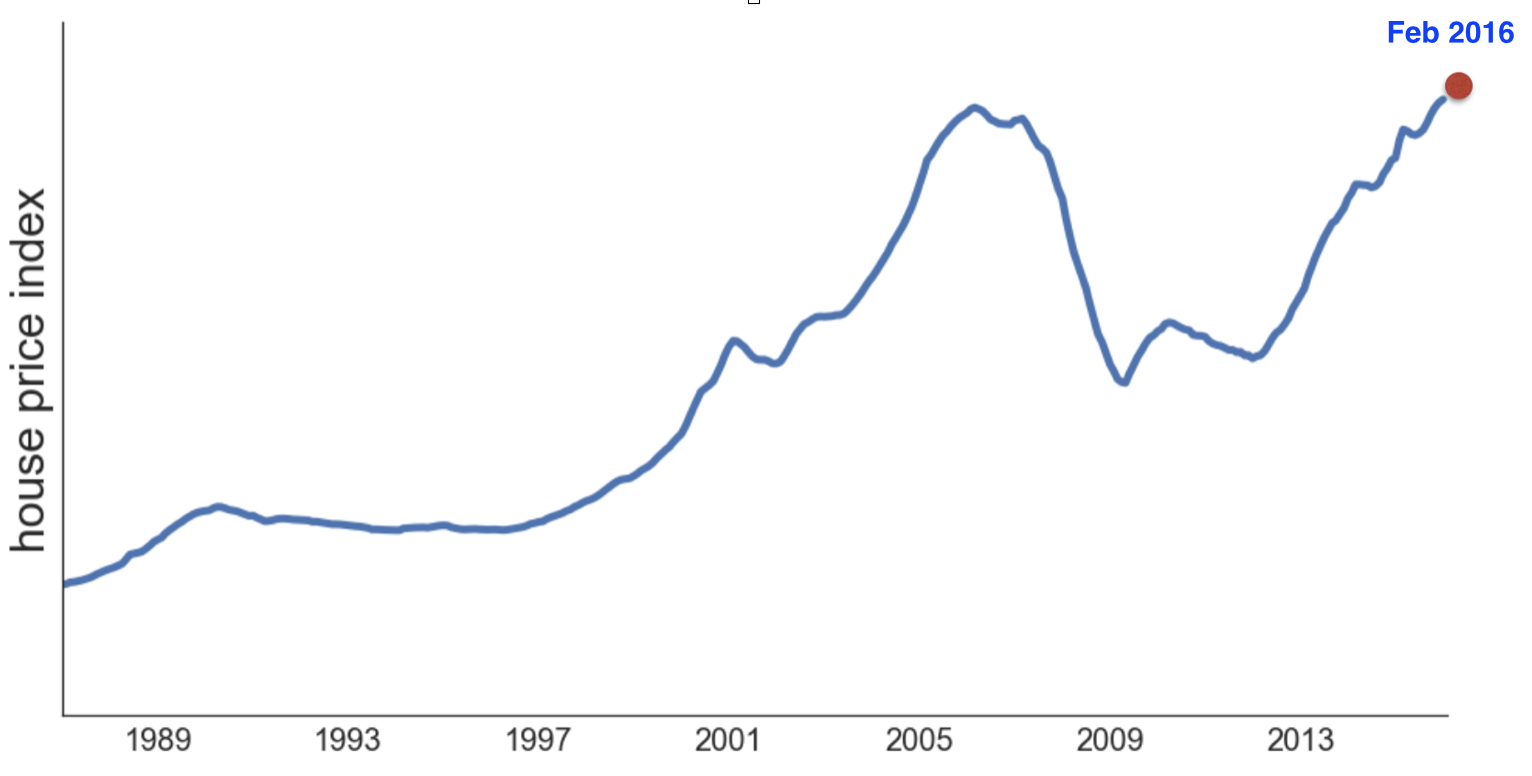
ARMA is a very basic time series method, it is not a good idea to use it to forecast the house price in the future (after a year or so). But for just one step ahead prediction, it gives a very good result. The time series analysis was done by R.
Preprocessing of the data
Get rid of the outliers
The first step of the analysis was to get rid of the outliers, which included: price per sqft bigger than 5000, finishedsqft bigger than 6000 and lot sqft bigger than 80000. The numbers were chosen by checking the histograms of those features.
Create new features
Some of the new features were created based on my understanding of the house market. The features included: log sale price, intercation term between bathrooms and bedrooms, and interaction term between totalrooms and finished sqft.
Clustering the neighborhood
As we know, the location of the house is a very important feature for the house price. I could use latitude and longitude of houses or the information about schools and crime rate around the houses. But as I am going to build a web application that everyone can use. I can’t expert users to enter those information, which is not that easy to obtain. For this resaon, I chose neighborhood of the house as an important feature and assumed that neighborhood represents the information of locations.
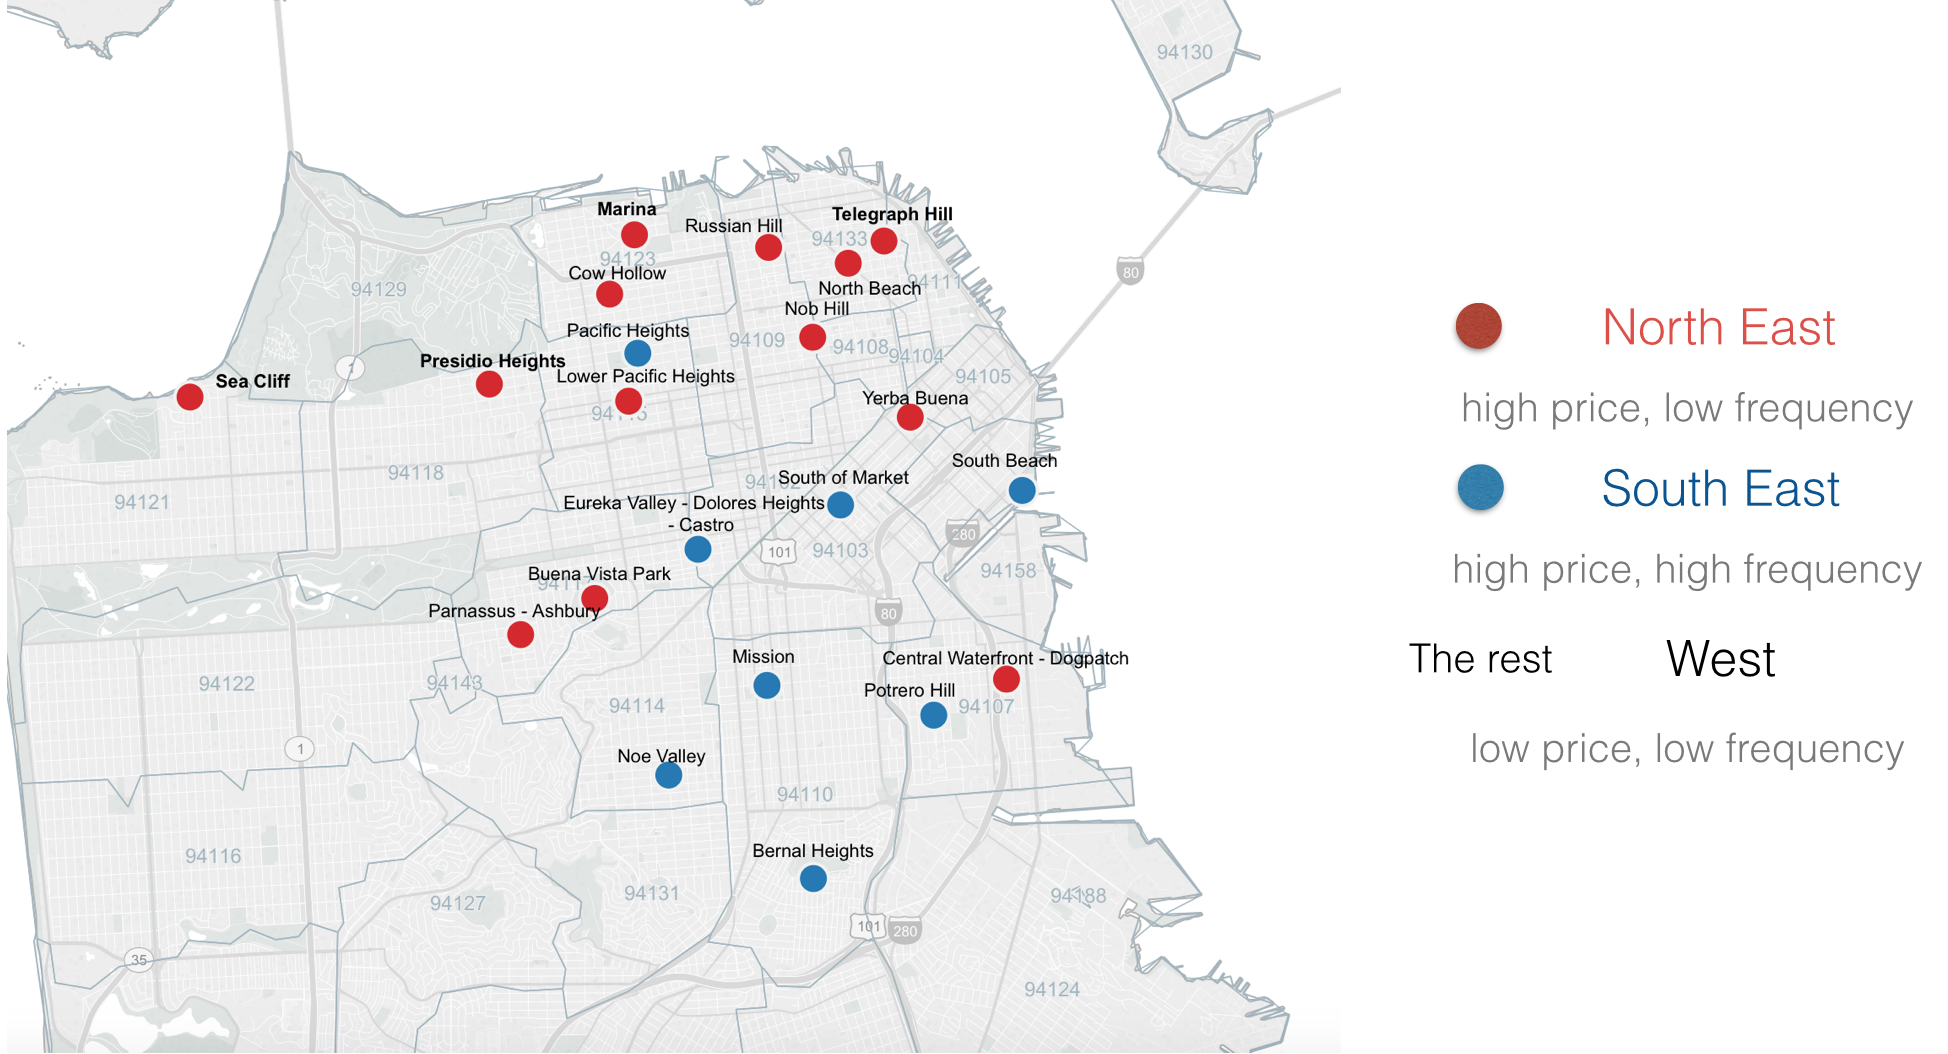
Before I started to train the model, I clustered the 71 neighborhoods of San Francisco in to three groups. I did the clustering not noly because It was not a good idea to create 70 extra dummy variables but also because some of the neighborhoods just didn’t have house transitions.
The clustering was based on the market behavior, which means the average number of sales per month and the average price per square feet. The result of the clustering is shown as below by using tableau public.
Regression models
After all the prepare, different models were tested. Single family houses and condos were trained seperately. The performance of the models were evaluated by cross-validation. (the table below) Among all the models, randomforest had the best performance and it is interesting that all the models performed better on single family houses than condos.
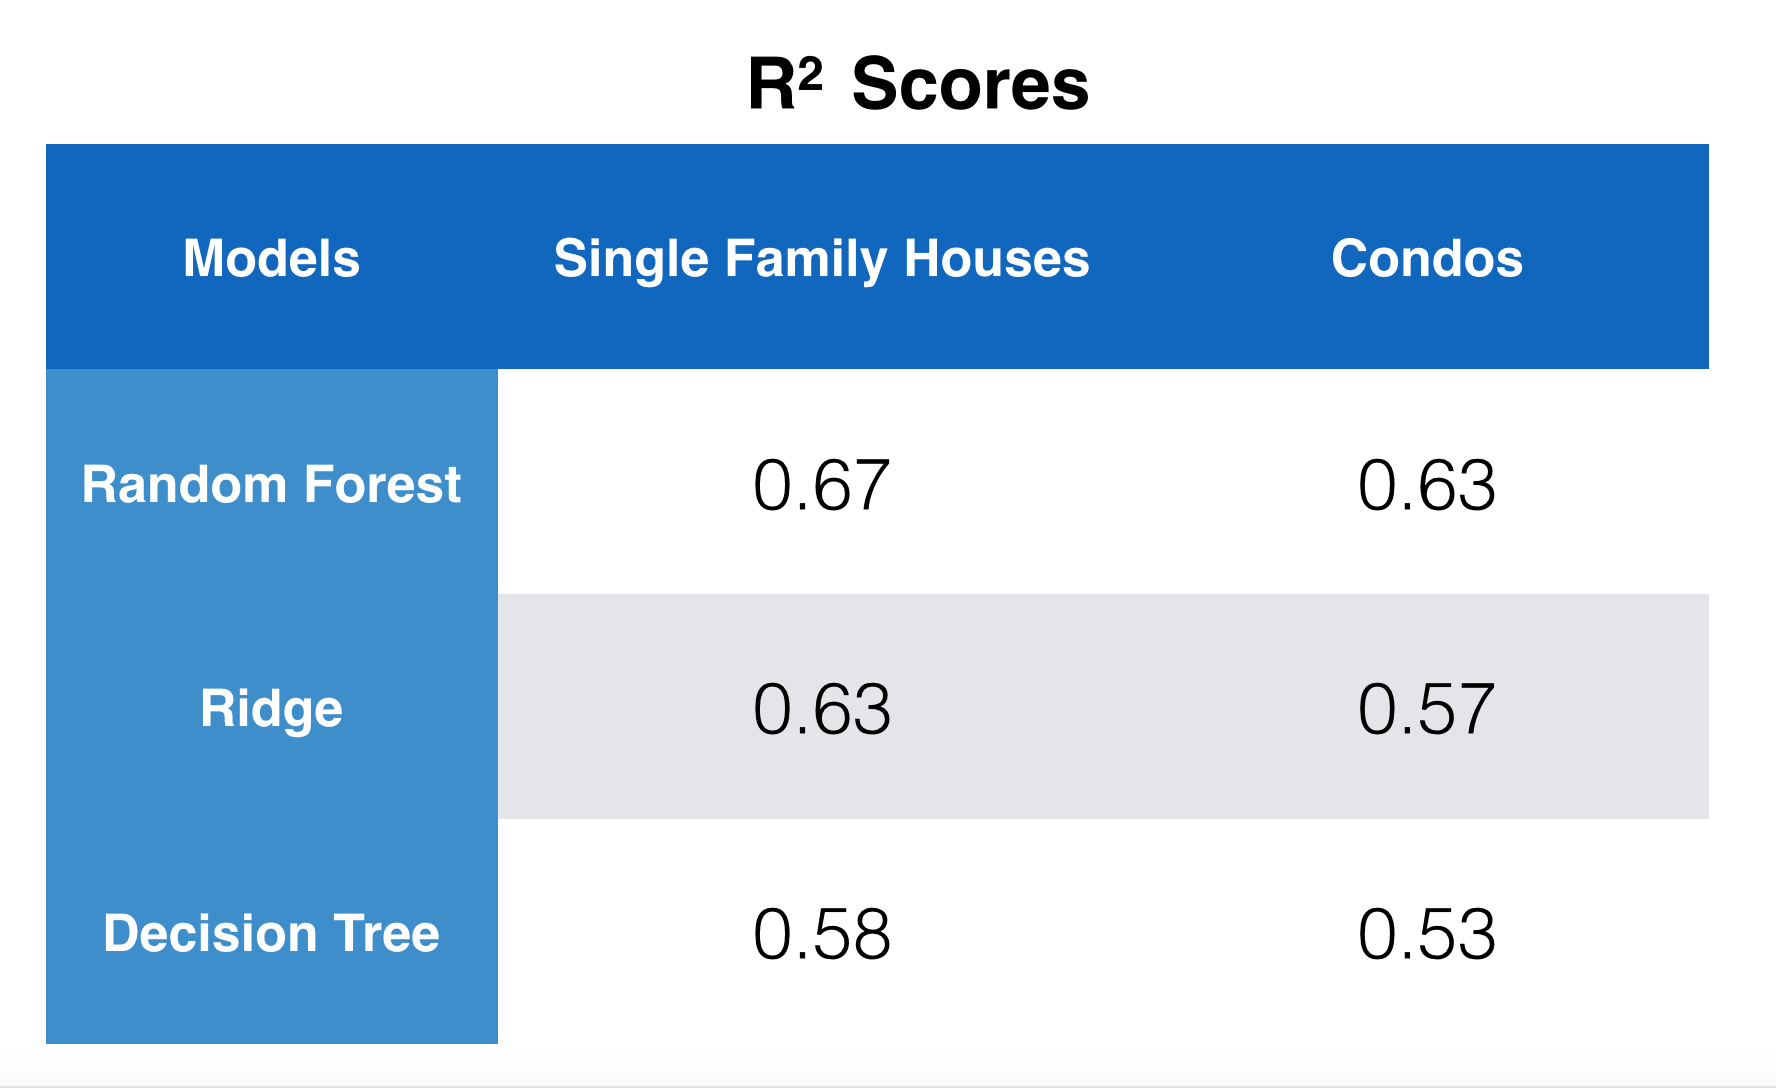
For the detail of the preprocessing and model training, please see the ipython notebook.
Important features
In randomforest and tree regression, the relative rank of a feature used as a decision node in a tree can be used to assess the relative importance of that feature. Features used at the top of the tree have a larger fraction contribution to the final prediction. The expected fraction of the sample they contributed to can thus be used as an estimation of the relative importance of the features. The important features for single family houses and condos are shown as below:
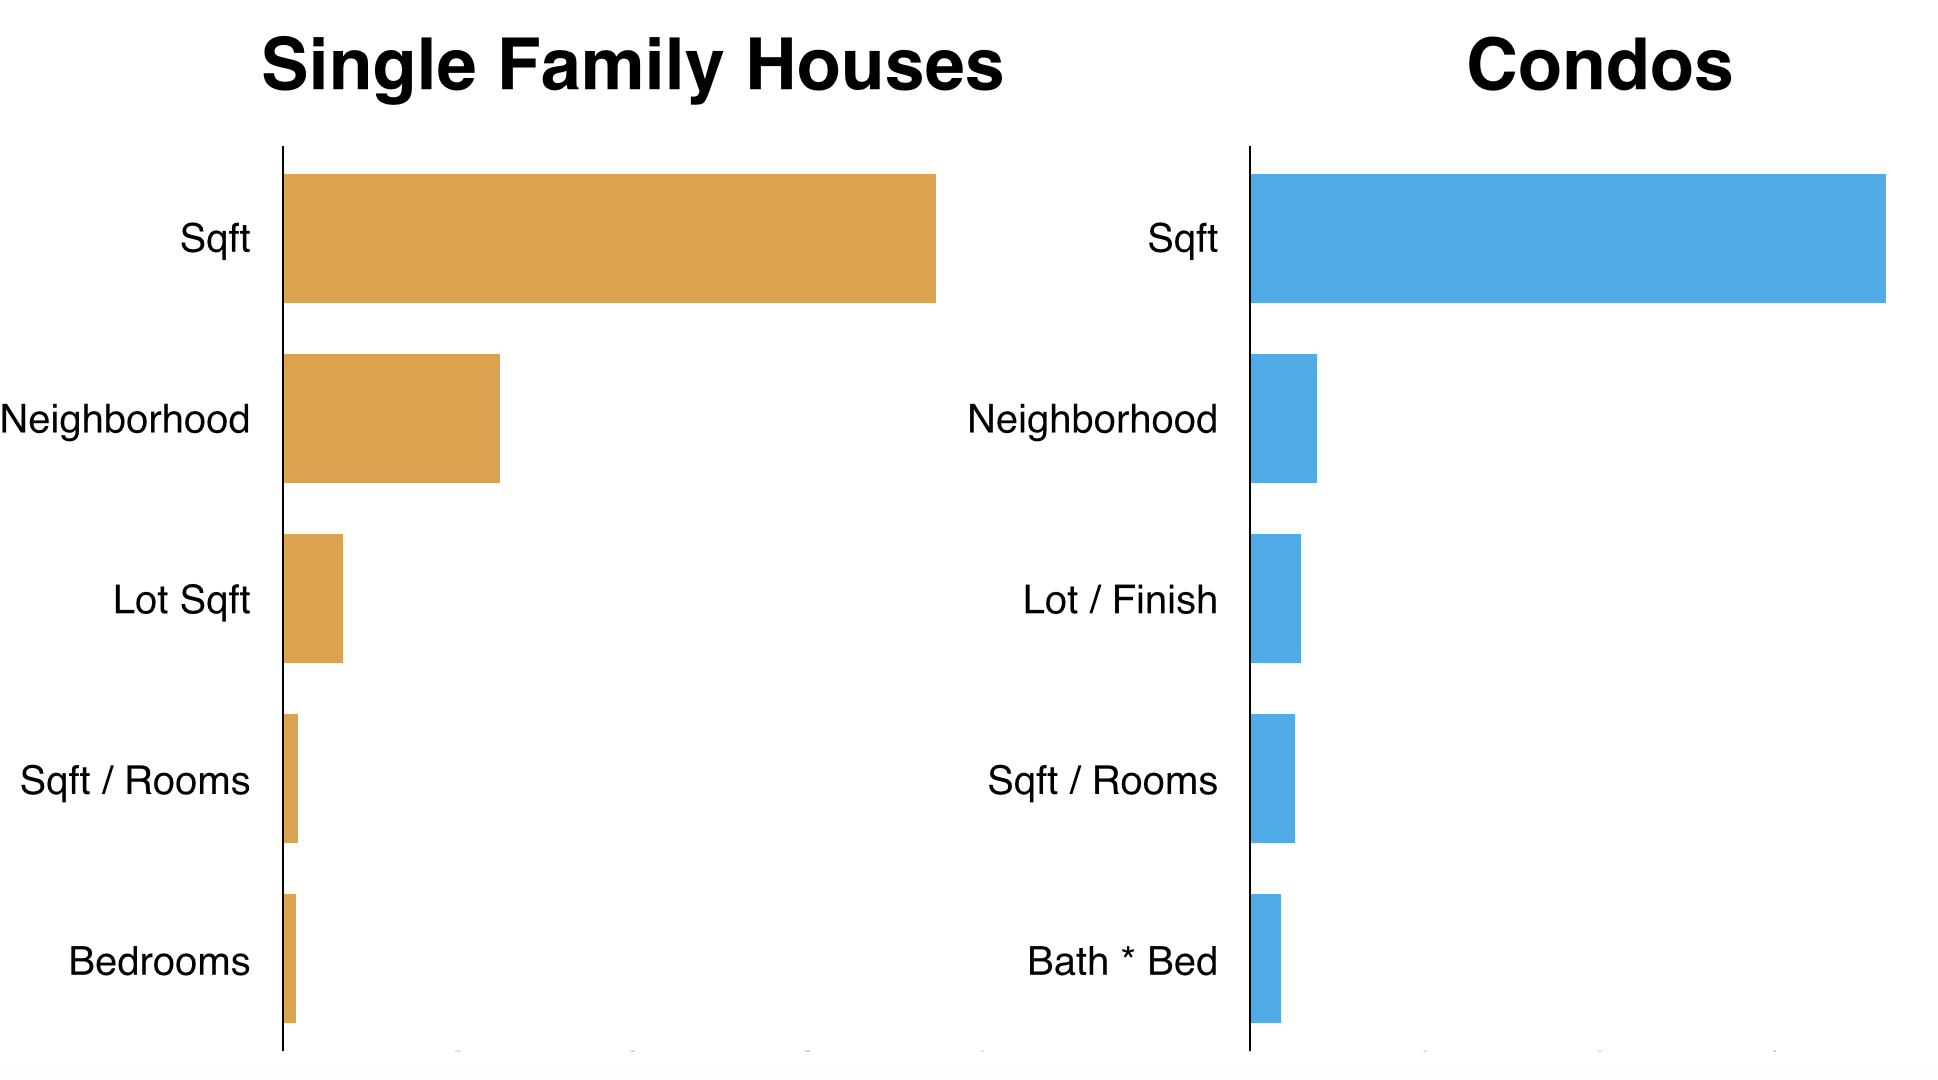
As we can see, beside the size of the houses location (neighborhood) information is really important for single family homes and condos, especially for single family homes.
For all the analysis process, please see https://github.com/RuiChang123/Regression_for_house_price_estimation/blob/master/linear_regression_house_price.ipynb
Web application
After training the model, I made a website application that we can use to get the estimation of the house prices based on the features. Since the model I chose is RandomForest Regression. I needed to use Flask to connect my model, which was implemented by python, with html file.
The code for the html script and python script is shown in the file https://github.com/RuiChang123/Regression_for_house_price_estimation/blob/master/house.html, https://github.com/RuiChang123/Regression_for_house_price_estimation/blob/master/predictor.py
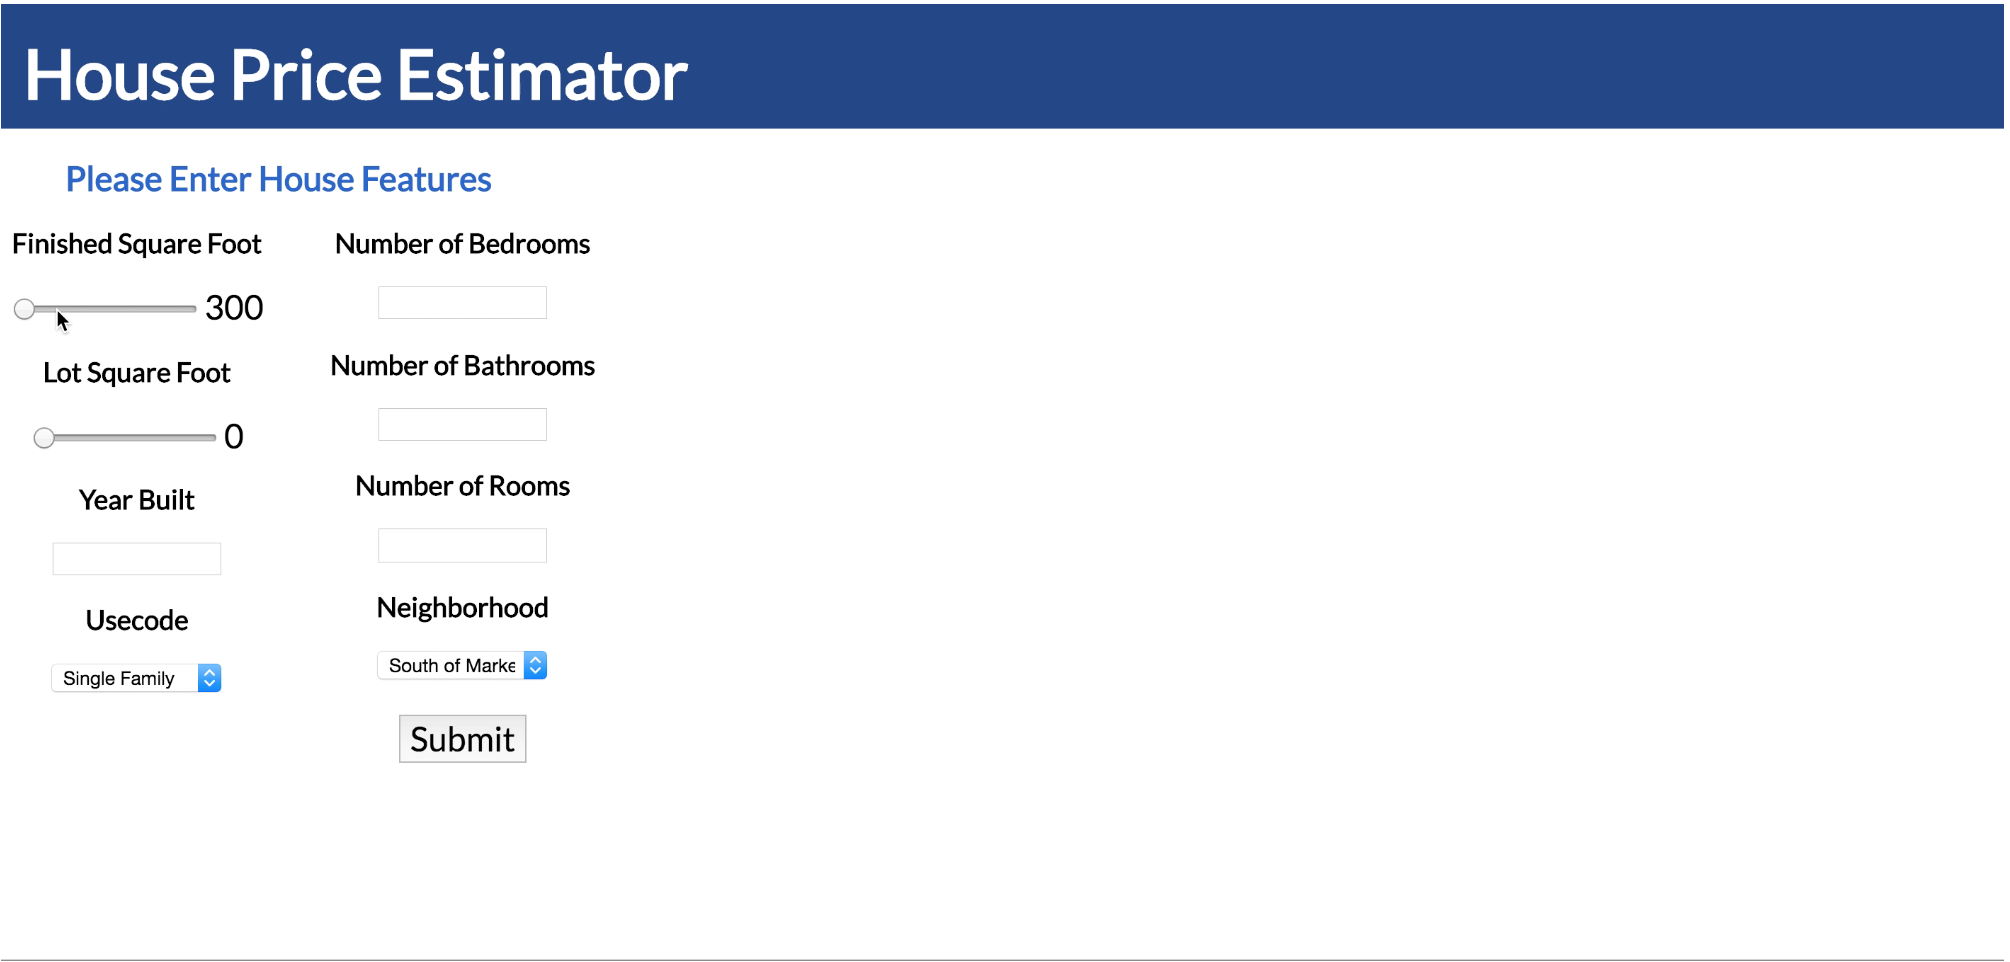
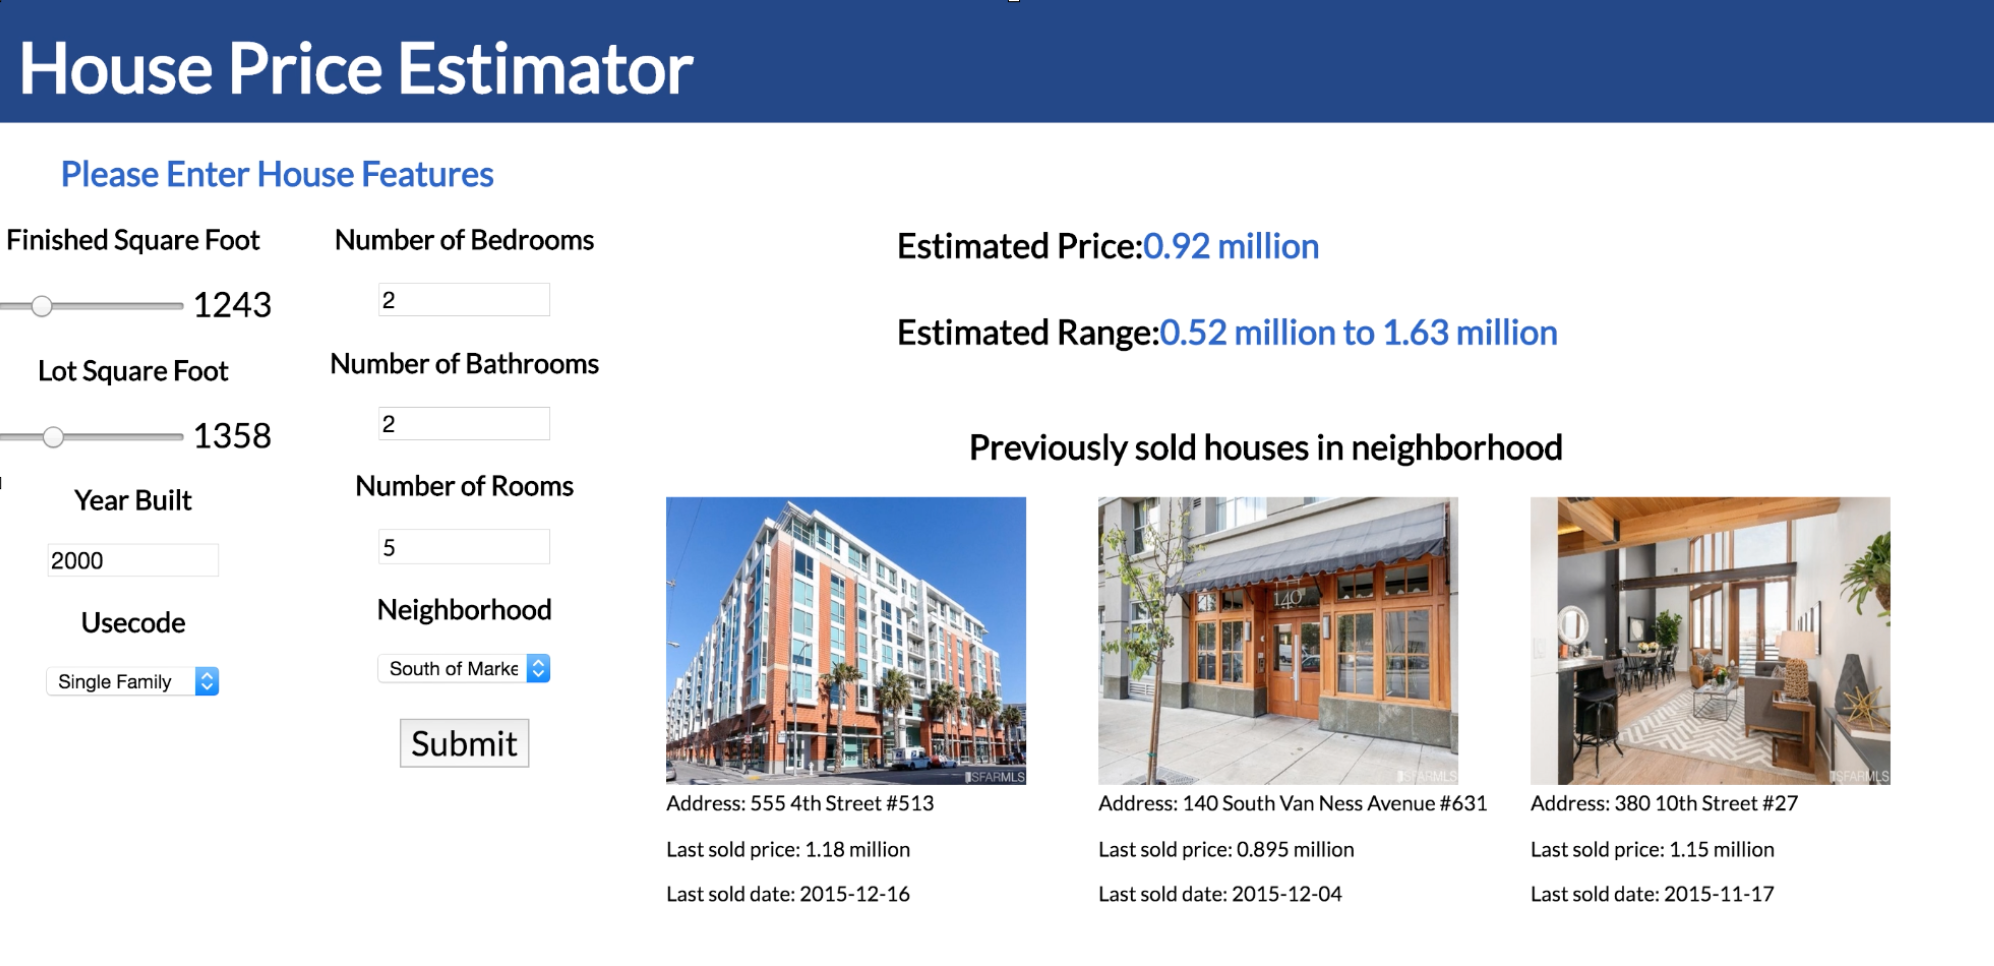
Since I don’t have a server to host the website (AWS is not free for me anymore), The pictures below are just a simple demonstration of how it works.
After entering the features, we will get the estimated price from the model and a price range from the history sales record. The web application will also send a API request to Zillow to get the three similiar houses that are sold recently and return the pics, addresses, sold dates and sold prices.
Future
It is obvious that some of the important features were not included in my model, such as kitchen, pool, style of the house. With more features and more data, better prediction can be made.
Forecasting is very important for the real estate market. By combining economic data, it is possible to give a forecasting of the price in the future.